A new survey sheds light on how Japanese consumers perceive and interact with overseas brands—and the results are eye-opening. While globalization may dominate headlines, it turns out that in everyday life, domestic products continue to win hearts, wallets, and workplace presence. From cosmetics to customer service, the preferences and behaviors revealed in this study paint a vivid picture of brand loyalty, cultural pride, and subtle gender dynamics.
10 Most Striking Takeaways
・66% of respondents say they “almost never” or “never” buy foreign products each month.
・46% don’t favor overseas brands in any product category.
・Domestic food brands are preferred by a massive 62%—the strongest support in the entire survey.
・57% believe Japanese brands offer far better customer service; only 3% say the same of foreign brands.
・Only 20% think overseas brands are more innovative than Japanese ones.
・Fashion and food are the most popular overseas categories—but only among a minority.
・“No particular reason” is the top reason for choosing a foreign brand (36%).
・Men favor foreign electronics and cars, while women prefer domestic cosmetics.
・35% of women say they never interact with overseas brands at work—more than men.
・Just 23% of all respondents regularly encounter overseas brands in the workplace.
Keep reading for a deeper dive into the data and what it means for marketers, brands, and business strategists in Japan.
Methods
Two nationwide surveys were conducted in Japan in 2025 to explore consumer and workplace attitudes toward domestic and overseas brands.
The first study, conducted via the Freeasy platform on April 8, 2025, gathered responses from 1,000 employed adults aged 30–59 (500 men and 500 women) across a wide range of occupations, including full-time employees, part-time workers, freelancers, medical professionals, and public sector employees. This survey examined purchasing frequency, brand preferences, and reasons for choosing domestic or foreign brands across various product categories such as electronics, fashion, food, and luxury goods. It also measured workplace exposure to domestic and overseas brands, including tools, software, and business partnerships.
A follow-up survey was conducted on April 18, 2025, targeting 100 respondents from the initial sample who reported regularly purchasing overseas-brand products. This supplemental survey explored their motivations for choosing foreign brands and asked them to name the countries of origin they preferred.
These surveys offer a detailed view of brand usage habits and perceptions among working-age consumers in Japan.
Results
Q1 How often do you purchase overseas brand products in a month, including food, household items, etc.?
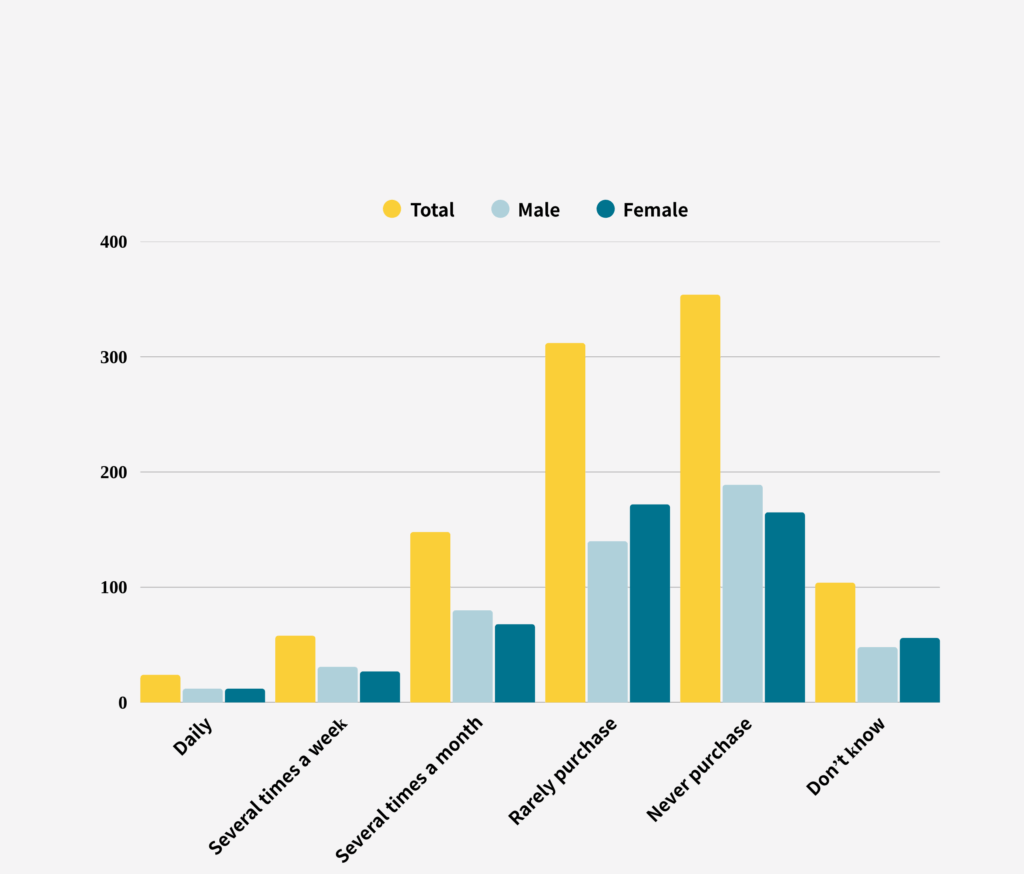
The data indicate that a large majority of respondents either never buy overseas brands (35.4%) or almost never do (31.2%), while a smaller share purchases them monthly (14.8%), weekly (5.8%), or daily (2.4%), and about 10.4% are unsure of their frequency. This distribution suggests that purchasing overseas products is relatively uncommon, with less than a quarter engaging on a regular monthly or more frequent basis. Most purchases of overseas brands occur sporadically rather than as a habitual part of monthly spending. Infrequent or non-purchase behavior accounts for roughly two-thirds of the sample combined. Overall, the trend shows minimal engagement with overseas brands among the majority of respondents.
Our data shows that women are more likely than men to report that they almost never buy overseas brands (34.4% vs. 28%), indicating a slightly lower engagement level. Conversely, men are somewhat more likely to say they never purchase at all (37.8% vs. 33%). In categories such as daily, weekly, and monthly purchases, the proportions between men and women are nearly identical, reflecting no meaningful gender gap. Additionally, the share of respondents uncertain about their purchase habits is similar for both genders. These patterns imply that while overall interest in overseas brands is low, women tend to engage even less than men.
Q2 How often do you purchase Japanese brand products in a month?
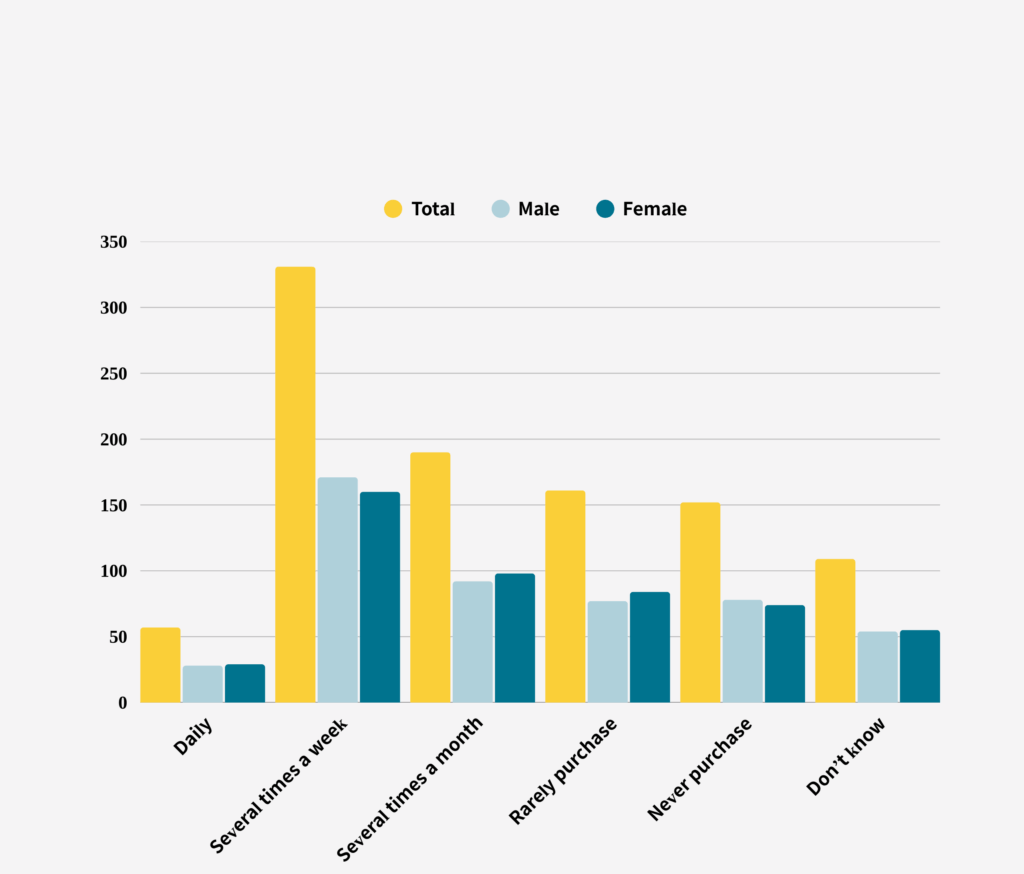
The data indicate that the most common purchase frequency is weekly (33.1%), followed by monthly (19.0%), with smaller shares buying daily (5.7%) or rarely (16.1% almost never, 15.2% never), and about 10.9% unsure. Overall, a clear preference for regular (weekly or monthly) purchases of domestic brands emerges, while infrequent or no-purchase behaviors account for roughly a third combined.
There are no substantial differences between men and women, as purchase frequencies across all categories are virtually identical.
Comparison Q1 and Q2
The data indicate that domestic brands are purchased much more regularly than overseas brands: about 33% buy domestic brands weekly versus only 5.8% for overseas, and 19% buy domestic monthly compared to 14.8% for overseas. Infrequent or non-purchase behavior is far more common for overseas brands—around 66% almost never or never buy—whereas only about 31% do the same for domestic brands. Daily purchases of domestic brands (5.7%) slightly exceed those for overseas (2.4%), while uncertainty is similar (about 10–11%). Overall, respondents show clear loyalty to domestic products, with regular buying four times higher than for overseas brands. The combined share of regular (weekly or monthly) domestic purchasers exceeds 50%, in contrast to less than 25% for overseas.
Our data shows that gender differences in overseas brand purchases are modest but present: women are more likely to almost never buy overseas (34.4% vs. 28% of men), and men somewhat more likely to never buy at all (37.8% vs. 33%). In contrast, purchase frequencies for domestic brands are virtually identical between men and women across all categories. Both genders report weekly domestic purchases at roughly one-third and show similar rates of non-purchase or uncertainty. Thus, while women engage even less with overseas brands than men, men and women treat domestic brand purchases almost the same.
Q3 Please select all product categories in which you prefer to purchase overseas brands.
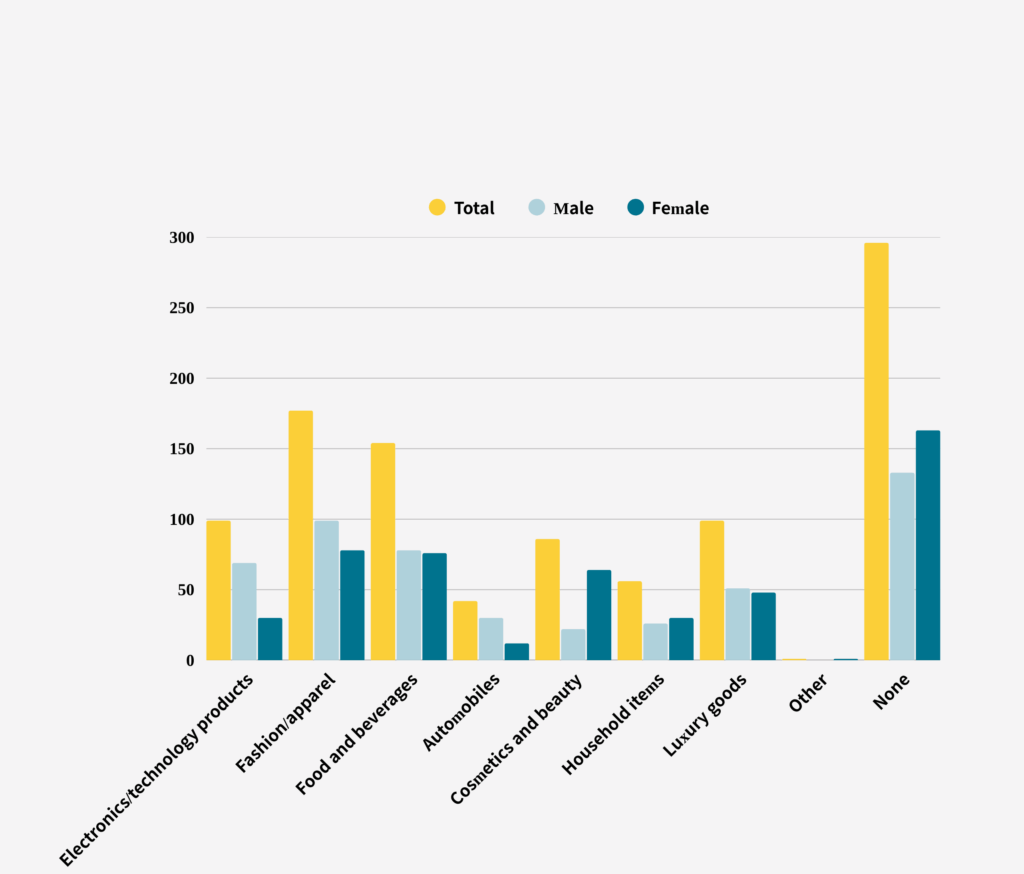
This question was answered by 311 men and 335 women that indicated having purchased overseas products
The data indicate that nearly half of respondents (about 46%) don’t favor overseas brands in any category, while among those who do, fashion (27%) and food & beverage (24%) are the most popular, followed by electronics and luxury goods (each about 15%). Overall, preference for overseas brands is limited to a few specific categories.
Our data shows that men are significantly more likely than women to prefer overseas electronics (about 22% vs. 9%), fashion items (32% vs. 23%), and automobiles (10% vs. 4%). Conversely, women show a much stronger preference for cosmetics and beauty products (19% vs. 7%). Additionally, a higher share of women report no preferred overseas category (49% vs. 43%).
Q4 Please select all product categories in which you prefer to purchase domestic brands.
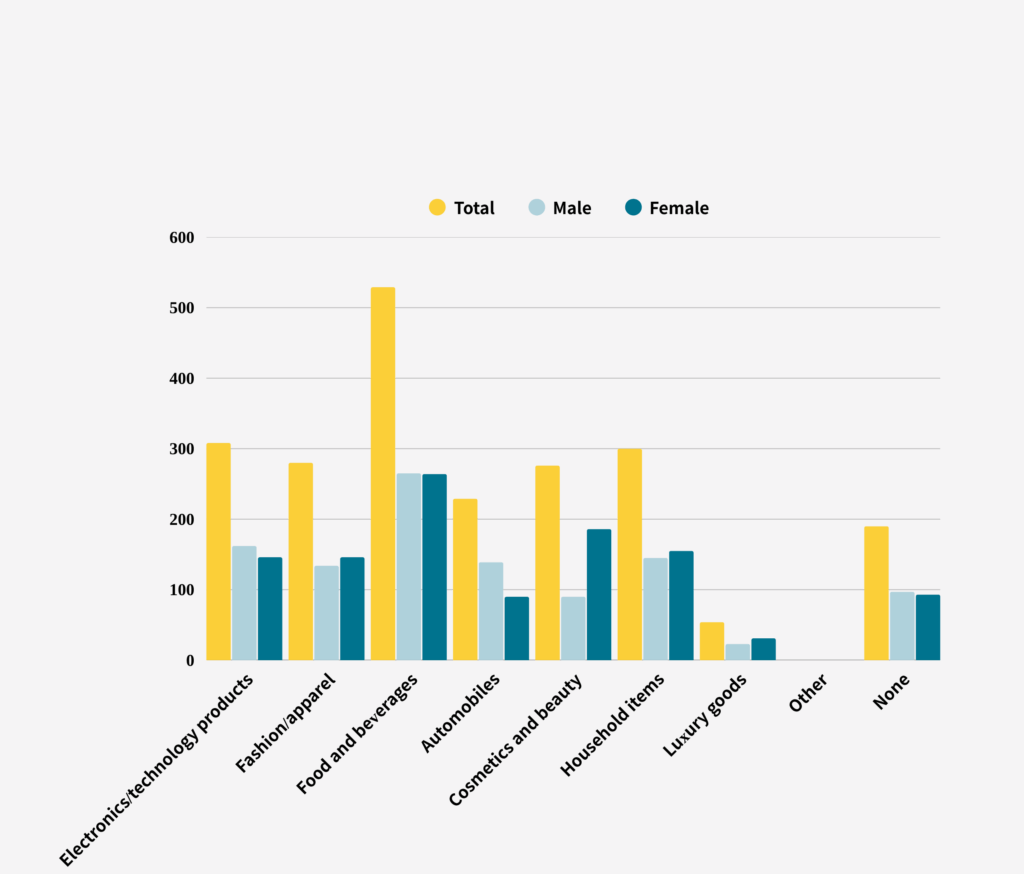
This question was answered by 422 men and 426 women who indicated having purchased domestic products.
The data indicate that the most commonly preferred domestic brand category is food & beverage (about 62%), followed by electronics (36%), home goods (35%), and fashion (33%), with automobiles favored by 27% and cosmetics at 33%, while roughly 22% have no particular preference. Overall, respondents show strong loyalty to domestic food products and a diverse interest in everyday goods.
Our data shows that men are significantly more likely to prefer domestic automobiles (about 33% of men vs. 21% of women), whereas women are much more inclined toward domestic cosmetics and beauty products (about 44% vs. 21% of men).
Comparison between Q3 and Q4
Overall trends
The data indicate that preference for domestic brands far exceeds that for overseas brands across most categories: for example, about 62% favor domestic food & beverage compared to 24% for overseas. Electronics are preferred domestically by roughly 36% versus about 15% for overseas, and home goods by 35% versus 9% for overseas. Fashion follows a similar pattern, with 33% leaning domestic and 27% choosing overseas. Automotive preference shows 27% for domestic against 6.5% for overseas, while cosmetics see about 33% domestic versus 13% overseas. A striking contrast is found in luxury items, where 15% of respondents favor overseas brands compared to only 6% for domestic. Overall, nearly half (46%) have no particular preference for overseas brands, whereas only about 22% lack a preference for domestic brands, highlighting stronger loyalty to local products.
Gender differences
Our data shows that men are considerably more inclined toward overseas electronics (around 22% of men vs. about 9% of women) and fashion (roughly 32% vs. 23%). Men also exhibit greater preference for overseas automobiles (about 10% vs. 4%), while women are far more likely to choose overseas cosmetics (around 19% vs. 7%). Additionally, women have a higher tendency to report no preference for overseas brands (approximately 49% vs. 43%). For domestic brands, men are much more likely to prefer domestic automobiles (about 33% of men vs. 21% of women), whereas women significantly favor domestic cosmetics (around 44% vs. 21%). These differences illustrate that men lean more toward technology and automotive categories abroad, while women emphasize beauty products and exhibit stronger loyalty to domestic cosmetics.
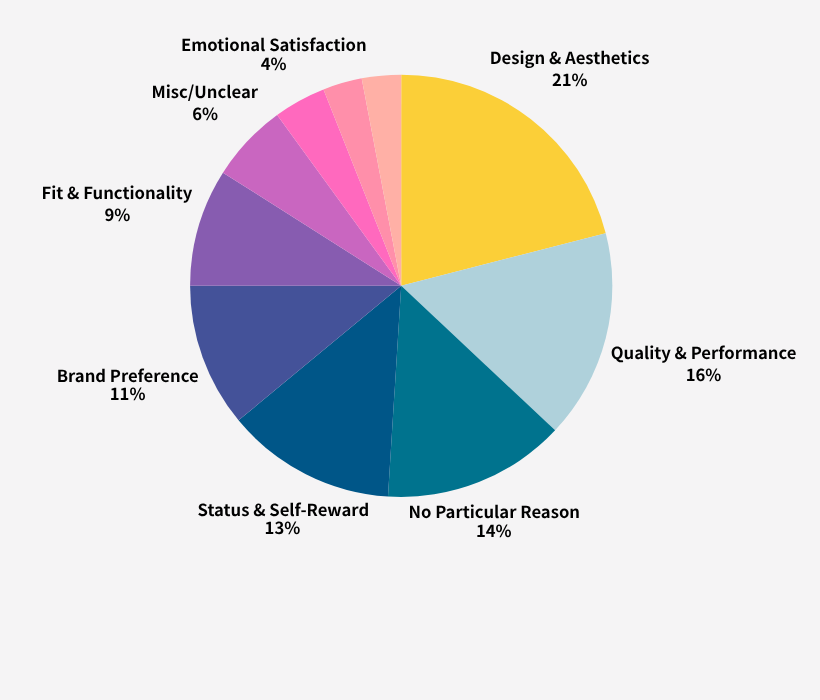
Q5 Please select all the reasons why you choose overseas brands.
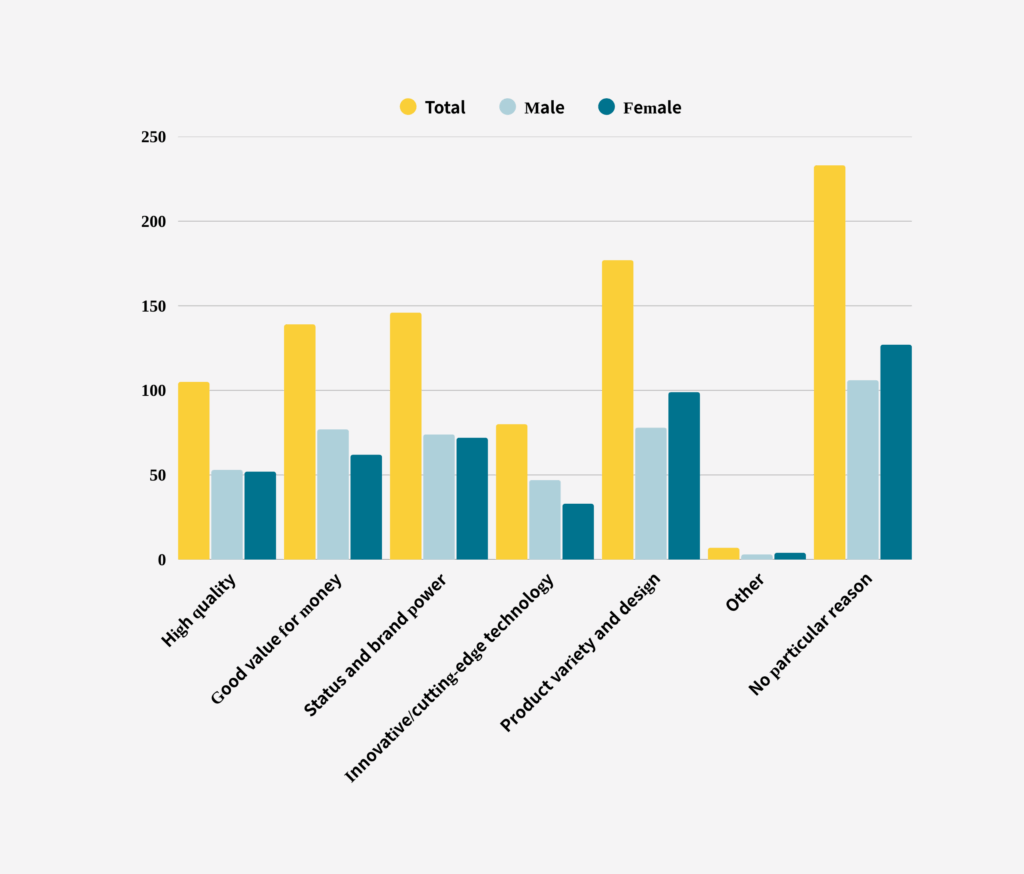
The data indicate that the leading reason for choosing overseas brands is having no particular rationale (about 36%), followed by appreciation for product diversity and design (27%) and brand status (23%), with cost performance (21%), quality (16%), and cutting-edge innovation (12%) also playing roles. Overall, while many lack a clear motive, those who do cite a mix of experiential and utilitarian factors.
Our data shows that men are notably more driven by cost performance (approximately 25% of men vs. 19% of women) and cutting-edge innovation (around 15% vs. 10%), whereas women’s reasons align more closely with the general trends without these emphases.
Q6 Please select all the reasons why you choose domestic brands.
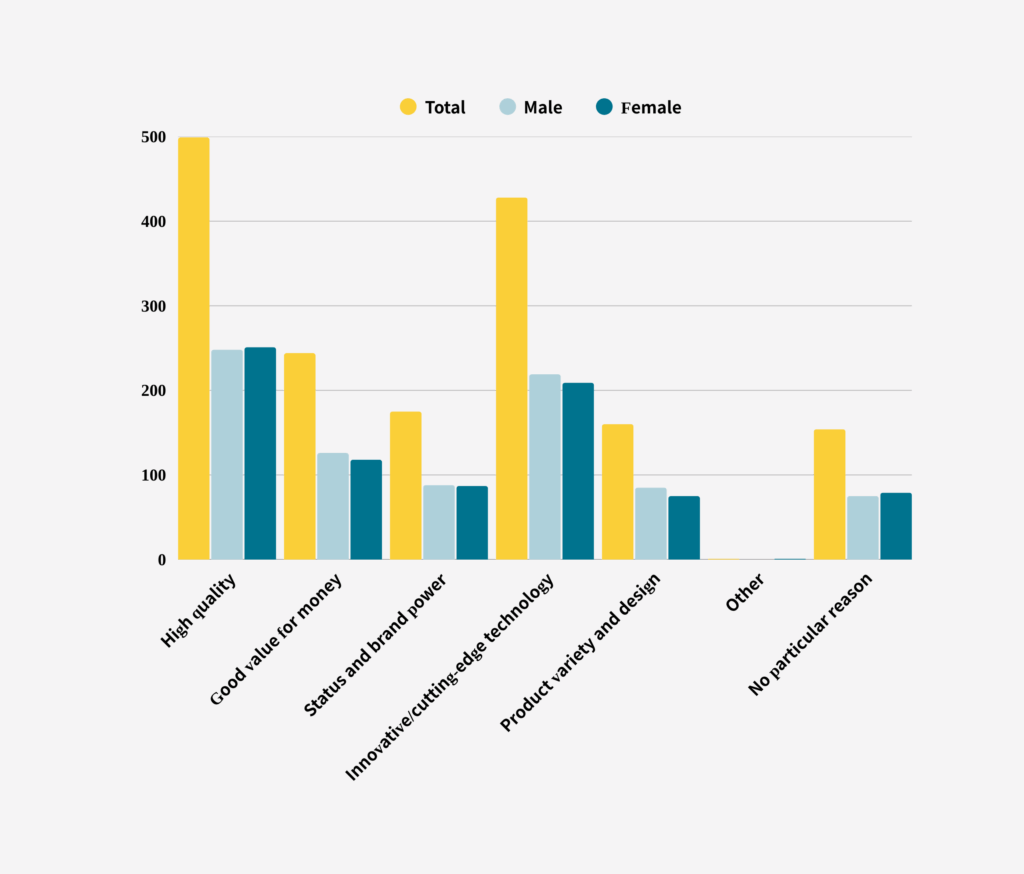
The data indicate that respondents overwhelmingly choose domestic brands for high quality (about 59%) and reliability (around 50%), with cost performance (29%) and cultural familiarity (21%) also factoring in, while roughly 18% cite no particular reason. Overall, practical considerations like quality and trust drive domestic brand preference.
There are no notable gender-based differences of meaningful magnitude in the reasons for selecting domestic brands.
Q7 Do you think overseas brands are more innovative than Japanese brands?
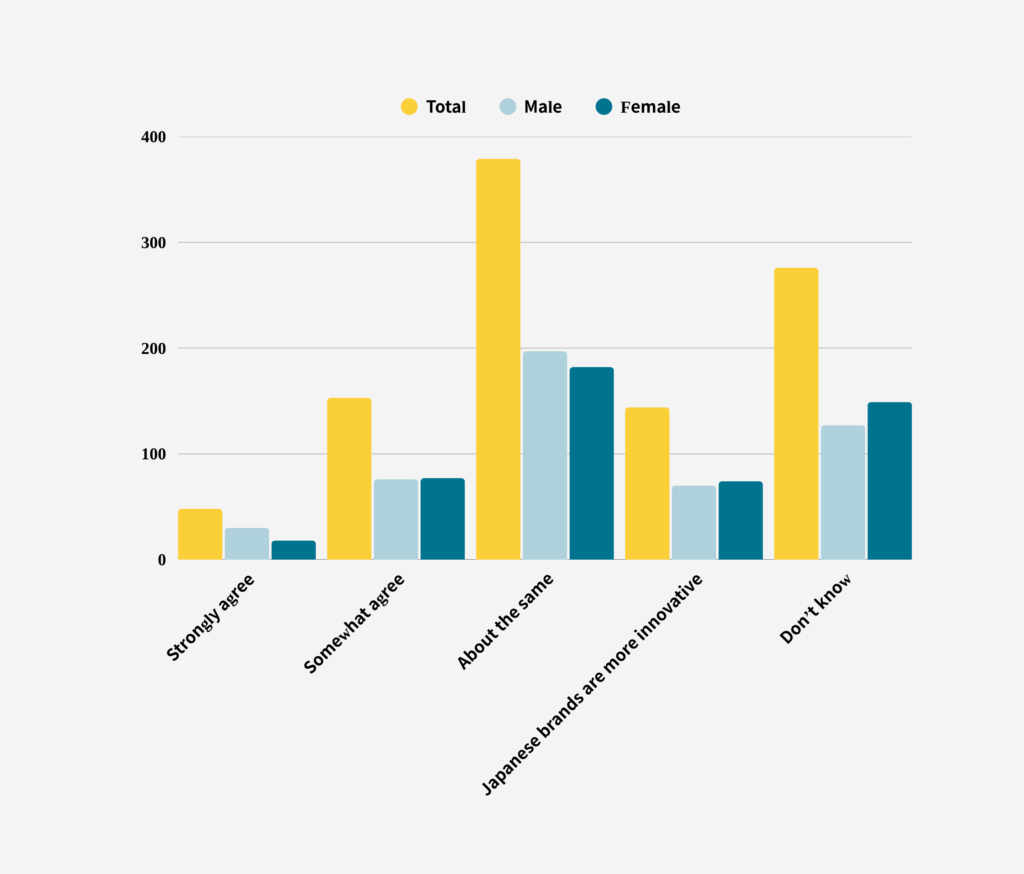
The data indicate that only about one in five believe overseas brands are more innovative, while a plurality (around 38%) see overseas and Japanese brands as equally innovative, and roughly 28% are uncertain. Overall, most respondents view innovation as comparable or are unsure rather than favoring overseas brands.
Men and women show virtually identical views on brand innovation, with no notable gender gaps.
Q8 Which brand do you think offers better customer service?

The data indicate that a clear majority (about 57%) believe domestic brands offer better customer service, with only a tiny fraction favoring overseas brands (around 3%), and the remainder either seeing no difference (19%) or being unsure (21%). Overall, domestic brands are perceived as superior in service.
Men and women share very similar perceptions of customer service quality, with no significant gender-based differences.
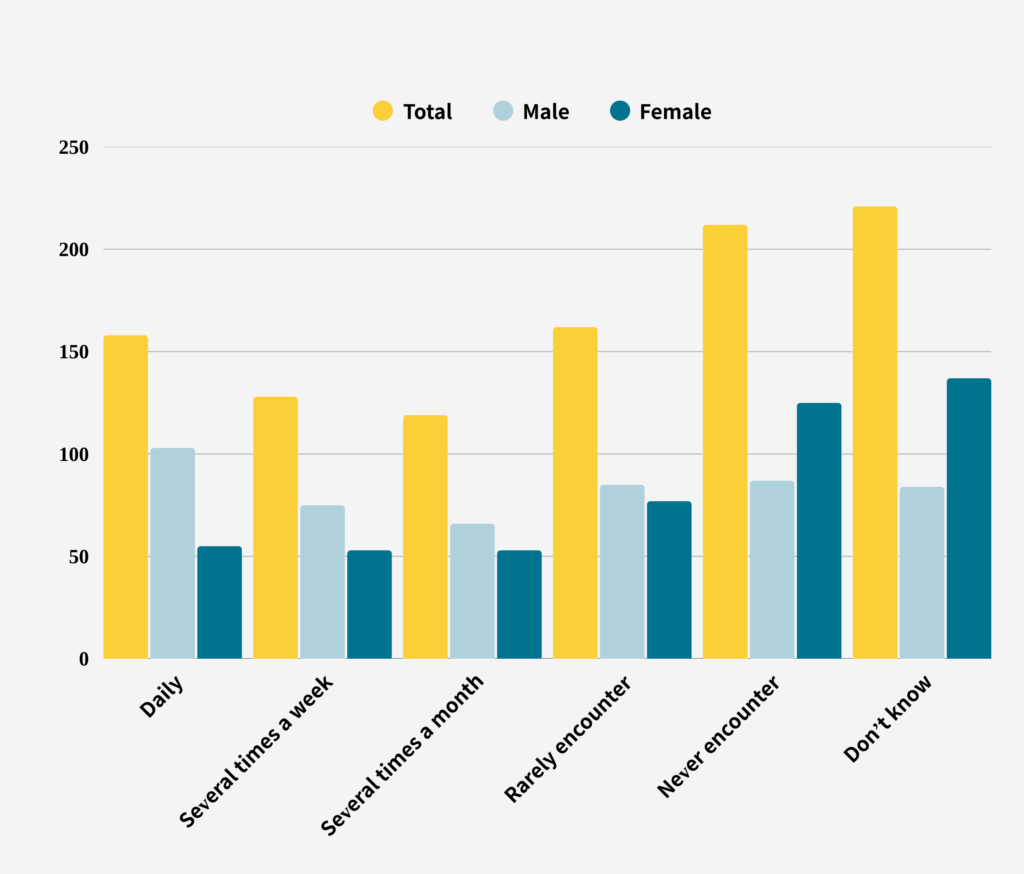
Q9 How often do you come into contact with overseas brands (tools, software, business partners, etc.) at your workplace?

The data indicate that about 23% of respondents interact with overseas brands at work on a daily, weekly, or monthly basis, while the majority have little to no contact (almost none 26%, never 32%), and 20% are uncertain. Overall, workplace engagement with overseas brands is limited.
Men are more likely to have daily contact with overseas brands (about 12% vs. 7%), whereas women are more apt to report never interacting (35% vs. 28%) or being unsure (23% vs. 16%).
Q10 How often do you come into contact with domestic brands (tools, software, business partners, etc.) at your workplace?
The data indicate that approximately 40% of respondents engage with domestic brands at work on a daily or weekly basis (16% daily, 13% weekly), while about 22% never interact and another 16% rarely do, with roughly 22% uncertain. Overall, domestic brand contact is more prevalent than overseas but still not universal.
Men are much more likely to have daily contact with domestic brands (about 21% vs. 11%), while women are significantly more inclined to report never interacting (25% vs. 17%) or being unsure (27% vs. 17%).
Comparison of Q9 and Q10
Overall trends
The data indicate that workplace contact with domestic brands is more frequent: about 16% engage daily and around 13% weekly, compared to roughly 9% daily and 5% weekly for overseas brands. Conversely, not interacting at all (“none”) or almost never interacting is higher for overseas brands (about 31% and 26%) than for domestic (around 21% and 16%). Overall, domestic brand contact is notably more common, while overseas brand engagement is relatively limited.
Gender differences
Our data shows that men report daily contact with overseas brands more than women (approximately 11.6% vs. 6.6%), and women are more likely to never interact with those brands (about 34.8% vs. 28.4%). For domestic brands, men are much more likely to have daily contact (around 20.6% vs. 11%) and less likely to never interact (about 17.4% vs. 25%). Additionally, women have higher rates of uncertainty (“unknown”) for both overseas (about 23.2% vs. 16.2%) and domestic (approximately 27.4% vs. 16.8%) brands.
To those who indicated in the previous survey that they regularly purchase overseas-brand products: what is your main reason for buying overseas brands?
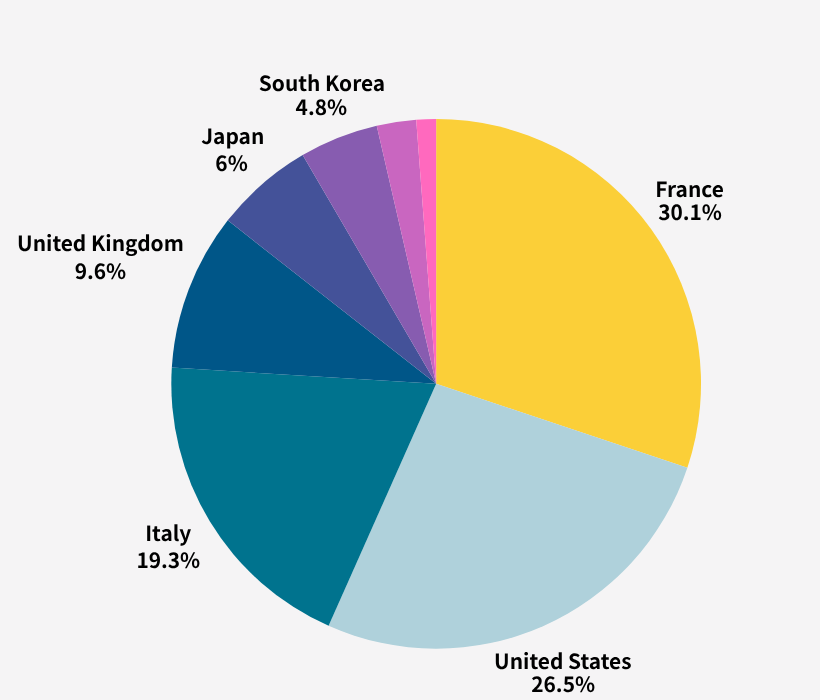
Which countries’ brands do you prefer to purchase? Please name three countries.
Conclusion
This survey makes one thing clear: Japanese consumers remain deeply anchored to domestic brands, driven by trust, quality, and cultural familiarity. While overseas brands have found small footholds in fashion and food, the broader market is still highly resistant—especially when it comes to service expectations and workplace integration. Gender differences further underscore how personal and nuanced brand relationships can be, with men and women aligning with different product types and interaction levels. For global brands hoping to expand in Japan, the message is sobering but valuable: success requires more than just prestige or innovation—it demands cultural sensitivity, service excellence, and strategic relevance. At the same time, domestic brands can take pride in their continued dominance and the strong emotional connections they foster. In a globalized world, Japan’s consumer landscape remains uniquely its own—rich with insight for anyone willing to look closely.